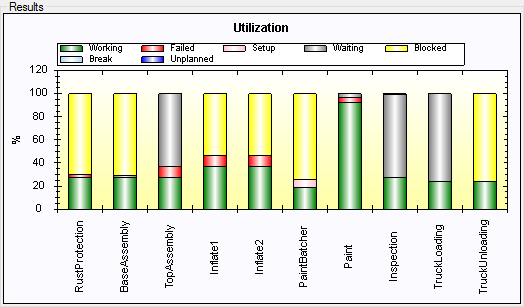
The output Utilization shows how much, percent of the time, each Operation/ ParallelOperation/ Assembly/ Disassembly/ Parallel Operation (utilization flow objects) has spent in different states, e.g. Working, Failed, Setup, Waiting, Blocked, Break, and Unplanned. This measure is displayed as a percentage of the total statistical simulation time (Simulation Horizon - Warm-Up1).
The utilization information can for example be used to detect utilization flow objects that potentially causes productivity losses. These productivity losses might be that the utilization flow object is working all the time or fails a lot, due to longer processing times or more frequent and/or longer failures than the surrounding utilization flow objects, and hence serves as a bottleneck for the entire production. Efforts in reducing the long processing times and/or improve the reliability of that flow object would in this case improve the over all productivity of the entire production.
Definition
The utilization of a utilization flow object (UFO) is calculated by logging how long time each utilization flow object spends in the different states mentioned in the previous section and divide the total sum of each state by the total statistical simulation time (Simulation Horizon - Warm-Up1). The formula below gives an example of how the Working-percentage is calculated.
|
∑nWorking_Timen |
|||
|
Workingi |
= |
|
, ∀ i ∈ O, (O = All UFO's) and where n ∈ Wi, (Wi = The states when UFO i has been working) |
|
Simulation Horizon - Warm-Up1 |

Result chart
The Results view displays the utilization of the different objects side by side in a 100%-stacked-barchart. Details about navigating these charts can be found here.
- Simulation Horizon and Warm-Up are described under Simulation settings.