This is a description of how shifting bottleneck detection is implemented in FACTS-Analyzer. The methodology for this bottleneck detection is based on the paper, Roser C. et al. (2002) Shifting Bottleneck Detection 1 , presented on the 2002 Winter Simulation Conference.
Note: The Shifting Bottleneck Detection increases the time it takes to run a simulation due to the logging of extra data during the simulation. Therefore the use of Shifting Bottleneck Detection should be carefully considered when time is critical, especially when running optimizations. The ratio between the average processing time of the bottleneck and the simulation horizon effects the magnitude of the increase in simulation time, i.e. the smaller ratio the larger increase in the time the simulation will take.
Consider a simple production facility consisting of three serially placed machines with buffers as the image below shows. All machines also follows a shift and have different availability.

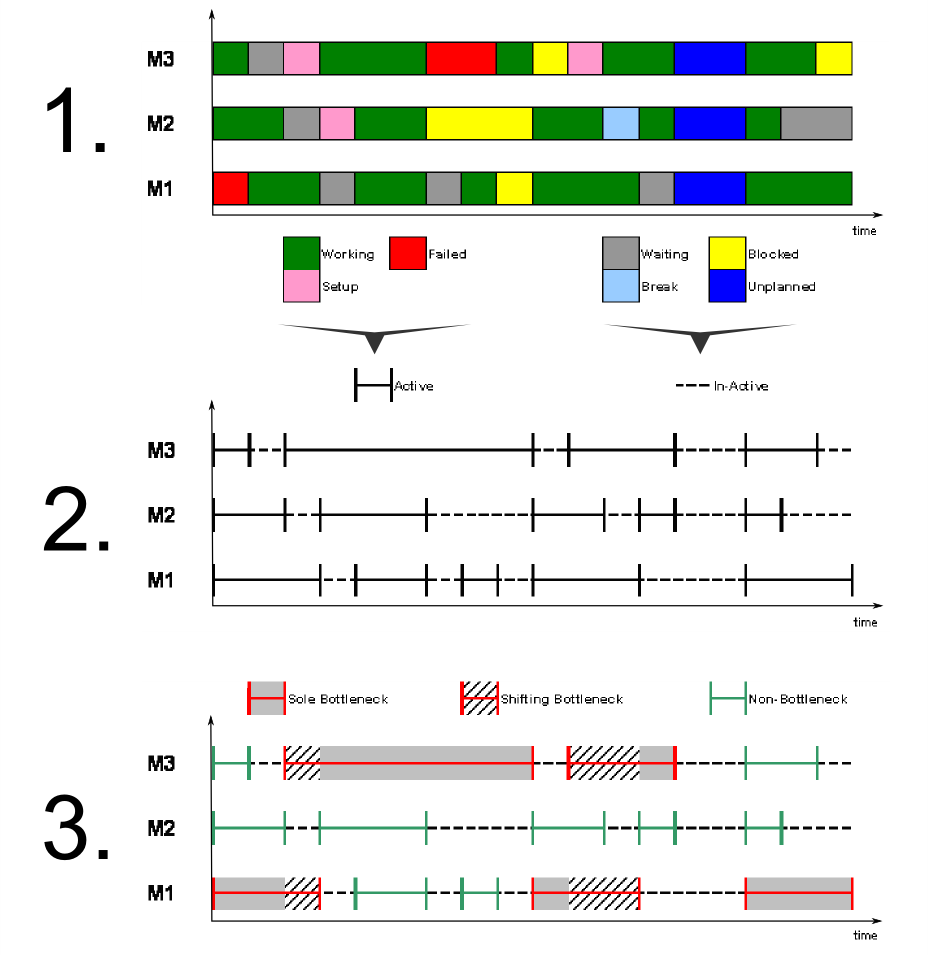
The state of all machines alternates over time during production. The different states are listed and color coded in the first step of the image below. The first step also shows an example of how the changes in states have been logged for the machines in the above mentioned production line. The second step of the shifting bottleneck detection methodology is to characterise the different states as active or in-active and group them accordingly, shown in step 2 in the image below. Having detected the active periods of all machines it is now time to determine which of these are momentary bottleneck periods. A momentary bottleneck period at any given point in time is the one with the longest active period at that time. Obviously if there are no active periods at a certain point in time there is no bottleneck at that time. Step three in the image below shows how these thoughts are used to divide the active periods into non-bottleneck and bottleneck periods. The bottleneck periods are further divided into sole bottleneck periods and shifting bottleneck periods. If two consecutive bottlenecks overlap the portions that overlap are marked as shifting bottleneck periods, i.e. the time when the momentary bottleneck switches from one machine to another they both are considered momentary bottlenecks during this shifting period.

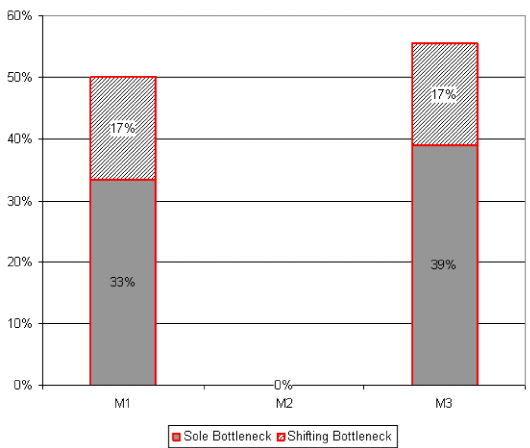
Lastly the image below shows how the results from the bottleneck detection example above are presented in a bar chart. The bars constitutes the sum of the percentages of the total time that each machine has been sole bottleneck and shifting bottleneck. The conclusion from this example is that an improvement of the throuhput of M3 would yeild a larger improvement of the overall system throughput than an throughput improvement of M1 or M2 would, since M3 is the primary bottleneck.

- Roser, C., Nakano, M., and Tanaka, M. 2002a. Shifting Bottleneck Detection. In Winter Simulation Conference, ed. E. Yucesan, C.-H. Chen, J. L. Snowdon, and J. M. Charnes, 1079-1086, San Diego, CA, USA. ‘