Statistical Distributions are used to model non-deterministic processes in the model, e.g. processing times. Depending on the process there might be different distributions to choose from. This topic lists and describes all distributions that can be used in FACTS-Analyzer.
- Constant-distribution
- Triangular-distribution
- Exponential-distribution
- Uniform-distribution
- Normal-distribution
- Lognormal-distribution
- Beta-distribution
- Gamma-distribution
- Weibull-distribution
- Discrete uniform-distribution
- Binomial-distribution
- Negative binomial-distribution
In the distribution editor the desired distribution is selected in a drop-down box and once a distribution is selected input-fields for its parameters appear below the drop-down box. Parameters marked with a red star are required whereas the ones without are optional. At the bottom of the distribution editor the distribution is shown as a string, this is also how it will be shown in the Property panel.
Constant ↑
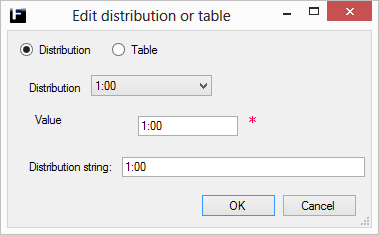
The simplest of distributions as it always returns a specified fixed value.
|
Parameter |
Description |
|
Value |
Desired positive real number. Range [0,∞). |
Triangular ↑
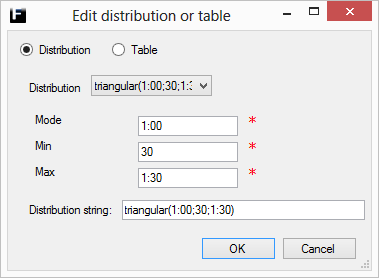
The triangular distribution returns a value within certain (user defined) bounds, but the values within those bounds aren't equally likely. One value (the Mode) are more likely than the rest and the probability of the other values decreases linearly from that value towards the borders of the bound.
See wikipedia for a more detailed description of the Triangular distribution.
|
Parameter |
Description |
|
Mode |
The most common value, i.e. the value with the highest probability. Range [Min,Max].
|
|
Min |
The lower bound for the range of allowed values. Range [0,Mode], where Min ≠ Max. |
|
Max |
The upper bound for the range of allowed values. Range [Mode,∞), where Max ≠ Min. |
Exponential ↑

The exponential distribution returns values representing the time between events that belongs to a process in which events occur independently of each other and at a constant average rate equal to the Mean of the distribution.
See wikipedia for a more detailed description of the Exponential distribution.
|
Parameter |
Description |
|
Mean |
The mean value of the distribution. Range (Min,Max).
|
|
Min |
The lower bound for the range of allowed values, works as a positive offest. Range [0,Mean), where Min ≠ Max.
|
|
Max |
The upper bound for the range of allowed values, truncates the distribution. Range (Mean,∞), where Max ≠ Min.
|
Uniform ↑

Returns a value within certain (user defined) bounds and all values within those bounds are equally likely.
See wikipedia for a more detailed description of the Uniform distribution.
|
Parameter |
Description |
|
Min |
The lower bound for the range of allowed values. Range [0,Max), where Min ≠ Max. |
|
Max |
The upper bound for the range of allowed values. Range (Min,∞), where Max ≠ Min. |
Normal ↑
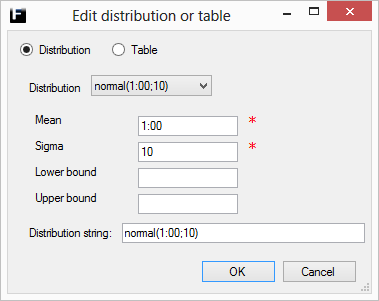
The normal distribution returns values that represent a process that have values that tend to cluster around a single mean value.
See wikipedia for a more detailed description of the Normal distribution.
|
Parameter |
Description |
|
Mean |
The mean value of the distribution. Range [Min,Max]. |
|
Sigma |
The standard deviation of the distribution. Range [0,∞). |
|
Min |
The lower bound for the range of allowed values, truncates the distribution by resampling until allowed value. Range [0,Max), where Min ≠ Max.
|
|
Max |
The upper bound for the range of allowed values, truncates the distribution by resampling until allowed value. Range (Min,∞), where Max ≠ Min.
|
Lognormal ↑
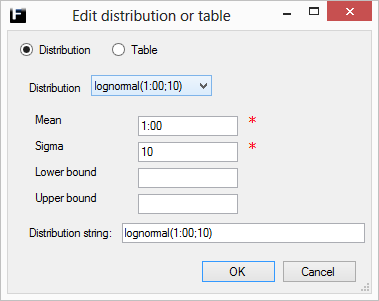
The lognormal distribution returns values that represent a process that can be described by the product of many independent positive factors whose values are close to 1.
See wikipedia for a more detailed description of the Lognormal distribution.
|
Parameter |
Description |
|
Mean |
The mean value of the distribution. Range [Min,Max]. |
|
Sigma |
The standard deviation of the distribution. Range [0,∞). |
|
Min |
The lower bound for the range of allowed values, truncates the distribution by resampling until allowed value. Range [0,Max), where Min ≠ Max.
|
|
Max |
The upper bound for the range of allowed values, truncates the distribution by resampling until allowed value. Range (Min,∞), where Max ≠ Min.
|
Beta ↑

With the two shape parameters Alpha, and Beta of the beta distribution the shape of the distribution can take a wide range of forms. This together with the possibility to linearly transform the distribution from its default support interval [0,1] makes it a a very versatile distribution.
See wikipedia for a more detailed description of the Beta distribution.
|
Parameter |
Description |
|
Alpha |
Shape parameter of the destribution. Range (0,∞). |
|
Beta |
Shape parameter of the destribution. Range (0,∞). |
|
Min |
The lower bound for the range of allowed values. Used to linearly transform the distribution from default [0,1] to [Min,Max]. Range [0,Max), default value 0. |
|
Max |
The upper bound for the range of allowed values. Used to linearly transform the distribution from default [0,1] to [Min,Max]. Range (Min,∞), default value 1. |
Gamma ↑
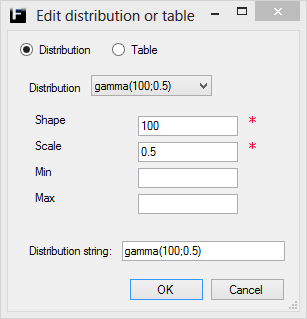
The Gamma distribution is defined by a Shape and a Scale parameter and can also be truncated using the Min and Max parameters.
See wikipedia for a more detailed description of the Gamma distribution.
|
Parameter |
Description |
|
Shape |
Shape parameter of the destribution. Range (0,∞). |
|
Scale |
Shape parameter of the destribution. Range (0,∞). |
|
Min |
The lower bound for the range of allowed values, truncates the distribution by resampling until allowed value. Range [0,Max), where Min ≠ Max.
|
|
Max |
The upper bound for the range of allowed values, truncates the distribution by resampling until allowed value. Range (Min,∞), where Max ≠ Min.
|
Weibull ↑
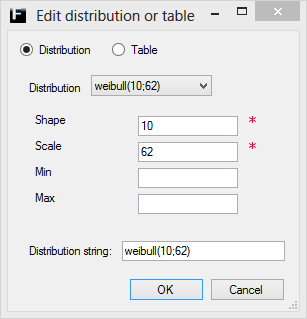
The Weibull distribution is defined by a Shape and a Scale parameter and can also be truncated using the Min and Max parameters.
See wikipedia for a more detailed description of the Weibull distribution.
|
Parameter |
Description |
|
Shape |
Shape parameter of the destribution. Range (0,∞). |
|
Scale |
Shape parameter of the destribution. Range (0,∞). |
|
Min |
The lower bound for the range of allowed values, truncates the distribution by resampling until allowed value. Range [0,Max), where Min ≠ Max.
|
|
Max |
The upper bound for the range of allowed values, truncates the distribution by resampling until allowed value. Range (Min,∞), where Max ≠ Min.
|
Discrete Uniform ↑
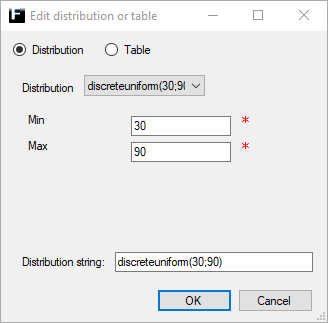
Discrete version of the uniform distribution that returns integer values within certain (user defined) bounds and all integer values within those bounds are equally likely.
See wikipedia for a more detailed description of the Discrete uniform distribution.
|
Parameter |
Description |
|
Min |
The lower bound for the range of allowed values. Range [0,1,2,...,Max), where Min ≠ Max. |
|
Max |
The upper bound for the range of allowed values. Range (Min, Min + 1, Min + 2,...,∞), where Max ≠ Min. |
Binomial ↑
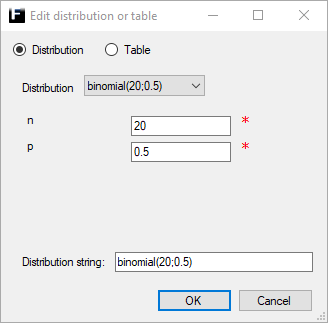
A discrete probability distribution used to model the number of successes n*p from n independent experiments.
See wikipedia for a more detailed description of the Binomial distribution.
|
Parameter |
Description |
|
n |
Number of independent experiements. Range [0,1,2,...,∞). |
|
p |
Probability of success in an experiment. Range [0,1]. |
Negative Binomial ↑
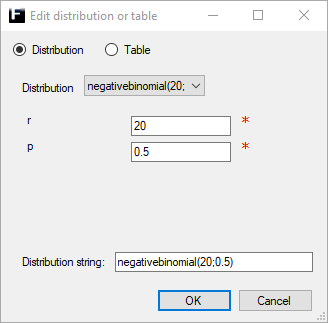
A discrete probability distribution used to model the number of failures before r successes are observed in a series of independent experiments.
See wikipedia for a more detailed description of the Negative binomial distribution.
|
Parameter |
Description |
|
r |
Number of desired successes. Range [0,1,2,...,∞). |
|
p |
Probability of success in an experiment. Range [0,1]. |