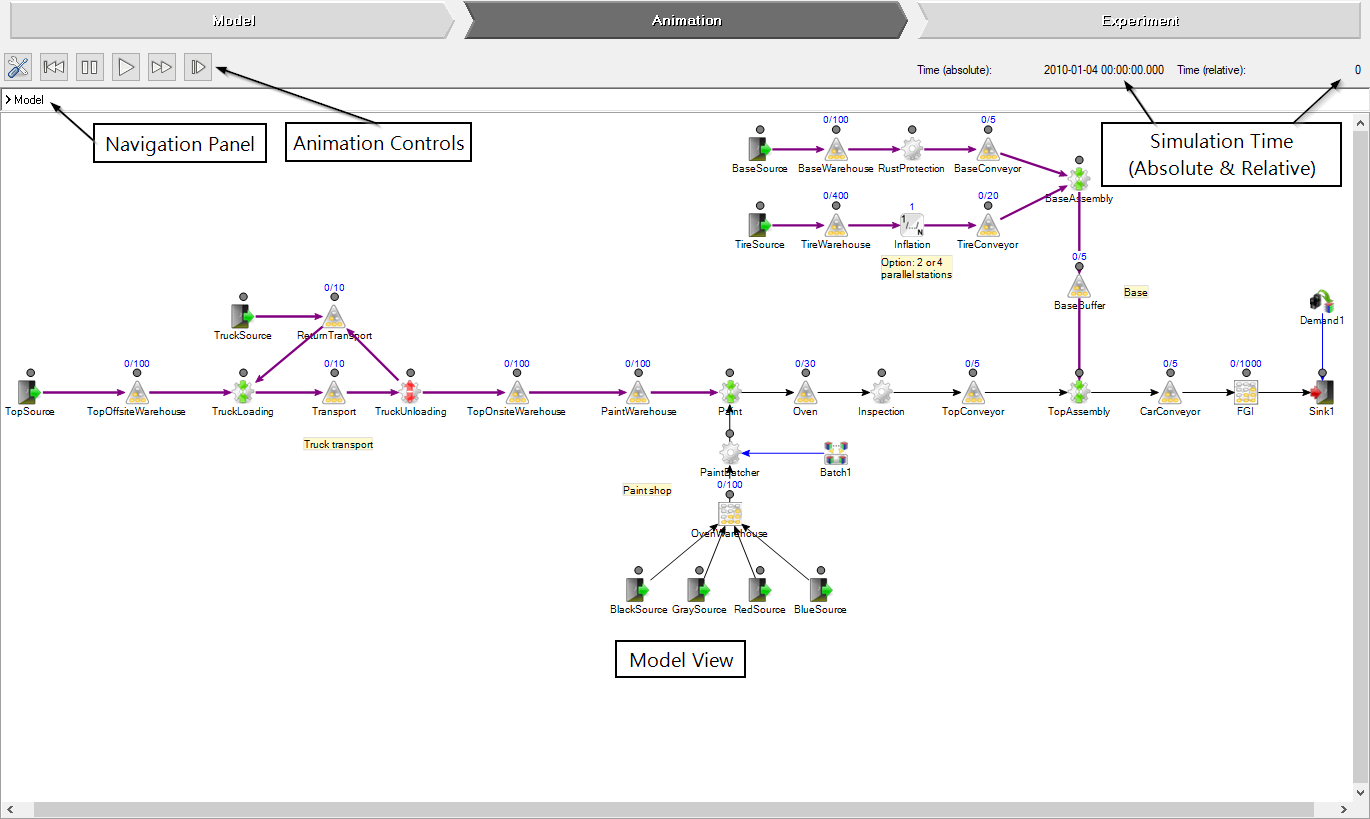
The animation step allows the behavior of the model to be analyzed. The flow of variants are visualized by animating them as they move through the model. It can be used to verify that the model actually behaves as expected and to find any problems in the model. There are also tools that can be used to visualize outputs. For instance, as a help for determining a suitable warm-up time.
The animation is controlled from the animation controls found above the navigation panel. More information about these controls can be found below. During the animation the simulation time is displayed in the top right corner both as an absolute time including (date and time of day) and a relative time from the start of the simulation.
Note: The start (date & time) is set from the Experiment step of the work flow.
 Settings ↑
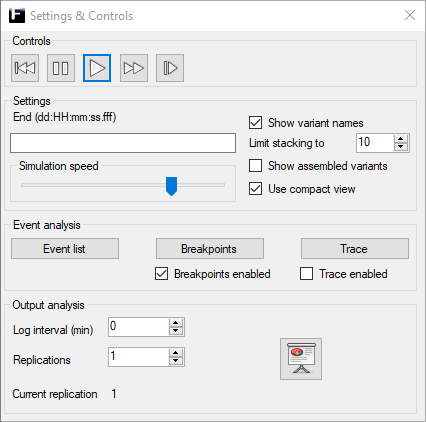
This dialog contains settings and controls for the simulation/animation (see image to the right). Details about them are given in the table below.
|
Setting/Control |
Description |
|
Reset |
Same as Reset. |
|
Stop |
Same as Stop. |
|
Start |
Same as Start. |
|
Start without animation |
Same as Start without animation. |
|
Step |
Same as Step. |
|
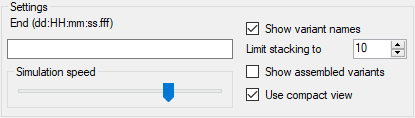
End (dd:HH:mm:ss.fff) |
A time specifying for how long the simulation(/animation) should be run starting from the selected start date and time of day. Specified on the format days:hours:minutes:seconds.fractions_of_a_second. |
|
Simulation speed |
Slider used to adjust the speed of the simulation. The speed of the simulation is controlled by a changeable time delay (i.e. this slider) between consecutive events, i.e. non-linear time and not scaled real time.
|
|
Show variant names |
On/Off switch for displaying variant names during the animation. |
|
Limit stacking to |
Stacking of variant names is limited by the number given here, e.g. for variants on a buffer.
|
|
Show assembled variants |
On/Off switch for displaying the names of all assembled variants.
|
|
Use compact view |
On/Off switch for grouping variants of the same type, only showing the current amount. The variant types are sorted alphabetically.
|
|
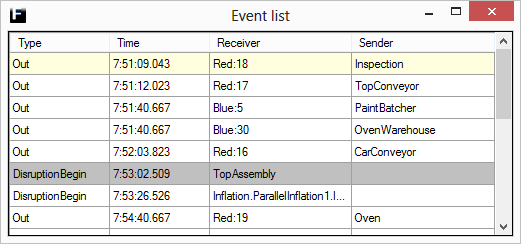
Event list |
Opens a dialog visualizing all active events and the order in which they will processed (see image below). It contains information about the type of event, at what time the event should be triggered, who is the intended receiver of the event, and finaly who (what object) that sent the event. By right-clicking specific events in the event list it is possible to add and remove breakpoints to them. It is also possible to run to events. Breakpoints are still active when running to an event so the simulation might stop before reaching it. Events are color coded to visualize breakpoints:
|
|
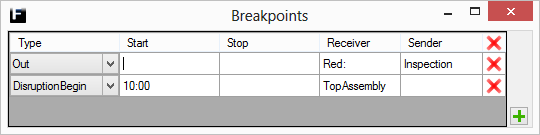
Breakpoints |
Breakpoints are used to stop the simulation when a certain event occurs. There are five
different stopping criteria, they are described in detail below. Critera that are left blank will match all events.
Add a new breakpoint
by clicking
|
|
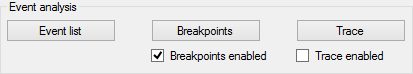
Breakpoints enabled |
On/Off switch for breakpoints. |
|
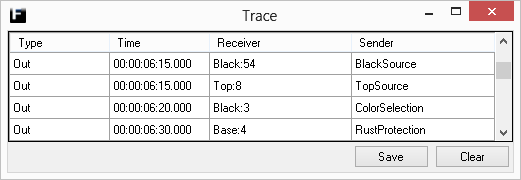
Trace |
Tracing of events can be enabled by checking the box "Trace enabled". All processed events will then be recorded in the trace window. The trace can be saved by clicking the "Save" button. The trace window can be cleared by clicking the "Clear" button.
|
|
Trace enabled |
On/Off switch for trace. |
 in the lower right corner. Breakpoints can be removed by
clicking
in the lower right corner. Breakpoints can be removed by
clicking  on the corresponding row.
Clicking
on the corresponding row.
Clicking  -button in the cell.
|
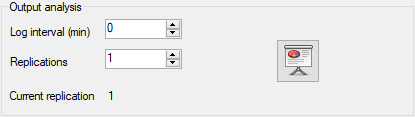
Log interval (min) |
Interval used for logging data when using the Output plotter. |
||||||||||
|
Replications |
Specifies how many times the simulation(/animation) should be run. |
||||||||||
|
Current replication |
Displays the progress (replication) of the simulation(/animation). |
||||||||||

|
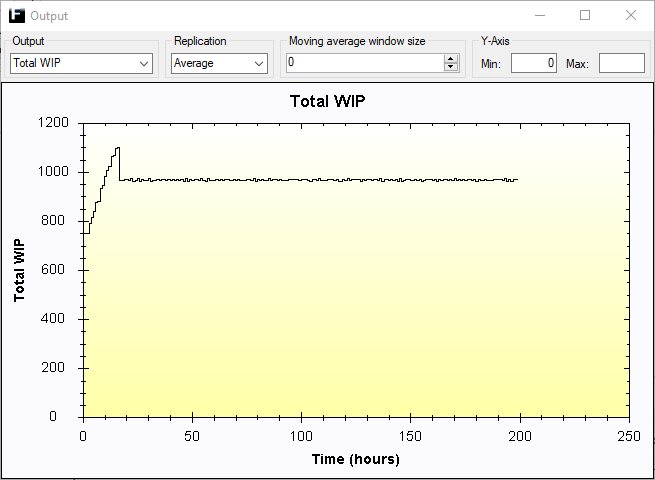
Opens a dialog for visualizing output from the simulation.
|
 Reset ↑
This will reset the simulation to its initial state.
 Stop ↑
This will stop the simulation.
 Start ↑
This will start the simulation with animations.
 Start without animation ↑
This will start the simulation without animation and without any delay between events.
 Step ↑
Step event by event. Useful together with the Event list.